
Key takeaways
- Any baby weight between the 3rd and 97th WHO percentile is medically normal for Indian babies.
- The Indian Academy of Pediatrics (IAP) recommends the WHO 2006 Child Growth Standards for all Indian children from birth to 5 years.
- Consistent growth along the baby’s own curve matters far more than a single percentile number.
- Babies typically gain 150–200 g/week in months 0–3, then 100–150 g/week from months 3–6, and 70–80 g/week from months 6–12.
- Crossing two or more percentile lines downward is the key red flag that needs medical review.
- Premature babies must be plotted using corrected age, not chronological age, until age 2.
Picture this: a mother at a well-baby visit watches the pediatrician plot her baby’s weight on the growth chart and notices the dot lands near the lower end of the page. Her stomach drops. Then, at home, her mother-in-law takes one look at the baby and says, “She looks thin. Are you eating enough by yourself?”
If this sounds familiar, here is what every parent in that room deserves to hear clearly: any weight between the 3rd and 97th percentile on the WHO baby weight chart is medically normal. A baby who has always sat at the 15th percentile and stays there is growing perfectly. What matters far more than the number on any given day is whether the baby is following their own consistent curve over time. This guide explains what that means, why the chart exists, and exactly when a paediatrician needs to take a closer look.
What Is a Baby Growth Chart and Why Does It Matter?
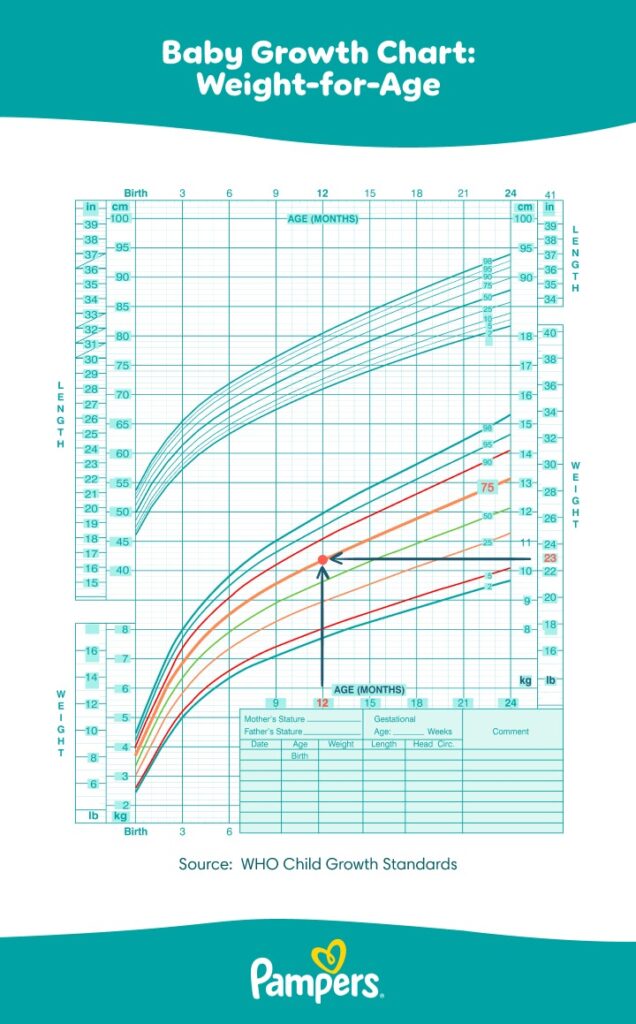
Picture Courtesy by Pampers
A growth chart is a visual tracking tool that plots three measurements over time: weight, length or height, and head circumference. These are recorded against the baby’s age to show a pattern of growth rather than a single snapshot. Growth is one of the most reliable indicators of a baby’s overall nutritional status and general health, which is why paediatricians return to it at every well-baby visit.
In India, parents receive a personal health record booklet at the hospital or municipal health centre after birth. Sometimes it is blue, sometimes red, depending on the city or state. The growth chart lives inside that booklet. Parents should bring it to every visit without fail. Digital records are also increasingly available through paediatric clinic platforms and the My Health Record system.
One important detail worth knowing: the WHO 2006 Child Growth Standards are the baby weight chart used in India, as recommended by the Indian Academy of Pediatrics (IAP) for all children from birth to 5 years since 2015. These Indian baby weight chart standards were built with Indian children as part of the reference population, making them the most appropriate tool for tracking growth in Indian babies. After age 2, most clinicians shift to CDC-based charts.
WHO vs Old Indian Growth Charts: Which One Should Parents Trust?
This question comes up often, especially when grandparents recall different numbers from their own parenting years or pull out old reference materials. The honest answer is that older Indian growth charts were built from average children in a population where undernutrition was widespread. That meant lower expected weights were labelled “normal,” which could make genuinely inadequate growth look acceptable.
The WHO 2006 standards were built from a global study of children across six countries, including India, who were raised in optimal conditions: breastfed, in non-smoking households, with adequate nutrition. They represent how Indian babies can grow when nourished well. That is a critical distinction. If there is any uncertainty about which chart the paediatrician is using, it is worth asking directly. The right answer is WHO 2006.
What Do Percentiles Actually Mean on a Baby Weight Chart?
Percentiles are the most misunderstood concept in routine infant growth monitoring, and clearing up this confusion changes how parents experience every well-baby visit.
A percentile tells you where a baby ranks compared to a reference group of babies of the same age and sex. If a baby is in the 40th percentile for weight, it means 40 out of 100 babies the same age weigh less, and 60 weigh more. That is all it means. It carries no information about health, intelligence, feeding quality, or parenting ability.
The most useful way to think about it: imagine 100 babies of the same age lined up from lightest to heaviest. A baby in the 5th percentile is one of the 5 lightest. A baby on the 90th percentile is one of the 10 heaviest. Both are in the normal range. Both are healthy if their growth is consistent. Percentiles are not school grades. A baby in the 10th percentile is not failing to grow. They are simply built toward the lighter end of the normal distribution, and for many babies, that is simply genetics at work.
The most important question at every visit is not “what percentile is the baby on?” but rather “is this baby following their own growth curve?” A drop from the 50th to the 20th percentile across two or three visits is significantly more meaningful than sitting steadily at the 12th percentile since birth. That consistent 12th-percentile baby is almost certainly thriving. The baby who has slipped across two major percentile lines is the one who needs a closer look.
The “Following the Curve” Explanation Indian Parents Often Need
Here is a scenario that plays out in clinics regularly. A mother comes in worried because her baby is on the 18th percentile while her neighbour’s baby of the same age is on the 65th. Her mother-in-law has been suggesting formulas to “boost” the weight. The baby is exclusively breastfed, alert, content, producing plenty of wet nappies, and meeting every developmental milestone.
When the growth chart is looked at across three visits, the baby’s weight points are running parallel to the 15th percentile line, visit after visit. That baby is following their curve. Their caloric intake is fine, regardless of how the volume of feed looks from the outside. Switching to formula will not meaningfully change a genetically lean baby’s percentile, and it risks reducing the mother’s breastmilk supply in the process. More on supporting milk supply naturally is covered in this guide on how to increase breast milk naturally.
Genetics matters enormously here. Tall, slender parents have tall, slender babies. A baby on the 15th percentile for weight who is also on the 15th percentile for height is proportionate. The weight-for-height chart will confirm this clearly.
Normal Baby Weight Gain by Month (0–12 Months): What to Expect
This is the section that answers what most parents are really searching for: how much should my baby weigh right now, and how much should they be gaining each week?
The first thing to understand is that weight gain is not linear. It is fastest in the early weeks and slows progressively as the baby gets older. A baby who gained 200 grams a week at 6 weeks and then gained 80 grams a week at 9 months is not growing worse. They are growing exactly as expected.
The First Two Weeks: Why Babies Lose Weight After Birth
Every baby loses weight in the first few days of life. This surprises many new parents, but it is completely normal and expected. Up to 10% of birth weight loss in the first four days is within the normal range as the baby passes meconium, fluid levels shift, and breastfeeding is being established. Weight should stabilise by day 4 to 7 and return to birth weight by day 14.
If the baby has lost more than 10% of birth weight, or has not returned to birth weight by the two-week mark, a paediatric review is needed. This is not cause for panic, but it does need to be assessed promptly rather than monitored further at home.
Month by Month Baby Weight Gain Reference Table (WHO Standards)
Based on WHO 2006 Child Growth Standards, recommended for all Indian babies from birth to 5 years by the Indian Academy of Pediatrics (IAP)
| Age | Expected Weekly Weight Gain | Key Milestone to Watch |
| Birth to Day 4 | Up to 10% weight loss is normal | Meconium passing and successful colostrum feeding |
| Day 4 to Week 2 | Weight stabilises, then rises steadily | Should return to birth weight by day 14 |
| 0 to 3 Months | 150 to 200 g per week | Fastest growth period overall |
| 3 to 6 Months | 100 to 150 g per week | Baby typically doubles birth weight around 4 to 5 months |
| 6 to 12 Months | 70 to 80 g per week | Growth slows as complementary foods are introduced |
| By 12 Months (Overall Gain) | Weight continues to increase steadily | Baby typically triples birth weight |
| After 12 Months | Approximately 2 to 3 kg per year | Temporary appetite dips during illness are common |
A note on feeding type: breastfed babies tend to gain weight faster in months 1 to 4 and then more slowly from 4 to 12 months. Formula-fed babies often show steadier, slightly higher gains and may be heavier by 12 months. Neither pattern is superior. Both are normal.
What About Premature Babies?
For babies born before 40 weeks, corrected age must be used when plotting on the growth chart until age 2. A baby born at 36 weeks who is now 4 months old is plotted at the 3-month line, not the 4-month line. This is not a workaround or a compromise. It is the medically correct approach and prevents unnecessary alarm when a premature baby appears behind a full-term baby of the same chronological age.
Parents of premature babies visiting clinics in Mumbai should confirm that their paediatrician is applying corrected age at every growth chart review. If the charts have been plotted without this correction, some of the previous data points may need to be reassessed.
The Indian Cultural Pressure Around Baby Weight: A Word That Needs to Be Said
In many Indian families, particularly across Maharashtra, Gujarat, Punjab, and parts of South India, a visibly chubby baby is seen as proof that the mother is doing well and the family is thriving. This belief has genuine historical roots. In a setting where visible undernutrition was common, a well-fed child was something to be proud of and something that signalled security. That context is real and it deserves acknowledgement.
But when this cultural lens is applied to a modern, normally-growing baby in 2025, it creates real and measurable harm. Mothers are pressured to stop breastfeeding and switch to formula to bulk the baby up, which does not meaningfully change a genetically lean baby’s percentile and often reduces milk supply. Solids get introduced before 6 months to “fatten the baby up,” which can cause gut stress and offers no long-term growth benefit. And mothers blame themselves and their bodies when the baby’s weight is simply reflecting the genetics they were born with.
The evidence actually points in the opposite direction of the cultural assumption. A lean-normal BMI in infancy is associated with better long-term metabolic health. Studies of Indian children show that rapid early weight gain significantly increases the risk of type 2 diabetes and cardiovascular disease in adulthood. India already carries a disproportionately high burden of both conditions. The goal has never been a heavier baby. The goal is a consistently growing baby.
For a broader look at healthy growth patterns and nutrition, this guide on healthy habits for kids: growth monitoring and nutrition tips is worth reading alongside this one.
Beyond the Chart: Other Signs Your Baby Is Growing Well
The growth chart is one tool, not the only tool. A baby who is genuinely thriving will show this in several ways that go beyond a number on a scale. This matters because parents who are focused entirely on weight percentiles can miss the fuller picture, and sometimes the fuller picture is actually very reassuring.
Signs a baby is feeding well and developing healthily include at least 5 heavily wet nappies every day with pale urine, soft and regular stools that have transitioned from dark meconium to yellow or mustard-coloured by the end of the first week, a baby who is generally content and settled between feeds rather than constantly crying from hunger, and steady head circumference growth which is one of the most sensitive indicators that adequate nutrition is reaching the brain.
Meeting developmental milestones matters too. A baby who is making eye contact, smiling socially, gaining head control, and starting to reach for objects is a baby whose development is on track. A practical guide to what to expect across the first year is available in this resource on baby crawling and walking milestones.
One practical caution: bathroom scales are not accurate enough for infants. They can be off by 200 to 500 grams, which sounds small but represents the difference between a normal week of gain and a worrying one on paper. Use the infant scales at the paediatric clinic or a nearby pharmacy for meaningful measurements. Weighing at home too frequently with an unreliable scale creates anxiety without useful information.
When Should Baby Weight Actually Be a Concern? Red Flags to Bring to the Paediatrician
After all the reassurance above, here are the signs that genuinely warrant a medical review. Parents deserve to know both sides clearly so they can act when it matters.
Contact the paediatrician if:
- The baby crosses two or more major percentile lines downward across two or three visits. For example, dropping from the 50th to below the 25th, or from the 25th to below the 3rd.
- There is no weight loss after the two-week mark outside of an illness, and even during illness the baby should recover weight quickly once feeding resumes.
- There has been no weight gain at all for more than one month in a baby under 6 months.
- There are visible signs of wasting: prominent ribs, thin limbs, or a loss of the normally round and soft baby belly.
- Weight is consistently below the 3rd percentile and continuing to fall rather than holding steady at that line.
- Birth weight loss exceeded 10%, or the baby did not return to birth weight by day 14.
- Poor feeding is happening alongside poor weight gain. The combination of both is more significant than either alone.
- Weight is increasing steadily while height is lagging significantly, which can be an early indicator of excess weight gain relative to the baby’s frame.
The Sequence That Tells a Clinical Story
When a baby is not receiving adequate calories, the body responds in a specific order that paediatricians watch for. Weight slows first and starts falling away from the curve. If the inadequacy continues, height growth begins to slow next. In severe or prolonged cases, head circumference growth slows last, which signals that there are not enough calories reaching the brain to support normal neurological development. This is precisely why weight, height, and head circumference are all measured at every visit, and why a drop in head circumference is taken particularly seriously.
A helpful resource for understanding what typical healthy growth looks like across childhood is this guide on is my child growing normally: red flags every parent should watch for.
The Growth Chart Is a Tool, Not a Verdict
The baby weight chart is one of the most useful tools in paediatric care, but it is a tool for tracking a journey, not a judgment on a parent’s effort or a baby’s worth. The baby who has always been small is not failing. The mother whose baby sits on the 20th percentile is not feeding poorly. The grandmother who worries about a lean baby is not wrong to care deeply, but the science now tells a different story than the cultural memory does.
What parents can do is keep every scheduled well-baby appointment, bring the health record booklet every single time, ask the paediatrician to walk through the chart at each visit, and trust the overall picture of a baby who feeds, settles, grows steadily, and reaches their milestones in their own way and at their own pace.
If there are any questions about the baby’s growth chart, weight gain, feeding patterns, or percentile trends, a consultation with Dr. Vivasvan Parekh at Vivasvan Child Care Clinic in Mumbai is the clearest next step. Bring the health record booklet and any previous weight measurements for the most complete picture.
Book a Consultation with Dr. Vivasvan Parekh
Frequently Asked Questions About Baby Weight and Growth Charts
There is no single normal weight for each month because healthy babies fall across a wide range. According to WHO standards, any weight between the 3rd and 97th percentile for a baby’s age and sex is considered normal. Most babies double their birth weight by 4 to 5 months and triple it by 12 months. A baby born at 3 kg may weigh around 6 kg by month 5 and around 9 kg by their first birthday, but these are averages rather than targets. Consistent growth along the child’s own curve matters most.
Weight gain is fastest during the first few months and gradually slows over the first year. Babies typically gain 150 to 200 grams per week in the first three months, around 100 to 150 grams per week from 3 to 6 months, and about 70 to 80 grams per week from 6 to 12 months. Individual variation is normal, and the overall upward trend on the growth chart is more important than exact weekly numbers.
Any percentile between the 3rd and 97th is considered healthy. There is no ideal percentile. A baby consistently tracking along the 8th percentile can be perfectly healthy, while one dropping from the 95th to the 70th percentile over several visits may need assessment. The pattern of growth over time matters far more than the percentile itself.
Weight becomes a concern when the growth pattern changes significantly rather than when the number appears low. Warning signs include crossing two or more major percentile lines downward, no weight gain for more than a month in a baby under 6 months, any weight loss after the first two weeks of life, or remaining below the 3rd percentile. A baby who is alert, feeding well, and meeting developmental milestones is usually growing appropriately.
The Indian Academy of Pediatrics recommends using the WHO 2006 Child Growth Standards for all Indian children from birth to 5 years. Earlier Indian reference charts were based on populations with widespread undernutrition and could underestimate growth concerns. The WHO standards include Indian children in their reference population and reflect expected growth under healthy nutritional conditions, making them the preferred tool for monitoring development.

Vivasvan Parekh
As a pediatrician and child specialist based in Mumbai, I bring over 15 years of experience in delivering comprehensive child healthcare. I hold an MD in Pediatrics and practice in Ghatkopar East and Chembur, where I focus on preventive and evidence-based pediatric care. My areas of expertise include vaccinations, newborn care, growth and development monitoring, and the treatment of common and complex childhood illnesses. I am committed to supporting parents with practical, reliable guidance on child health, nutrition, and overall well-being. Through my blog, I share trusted insights on pediatric health, helping parents make informed decisions about their child’s care and development.